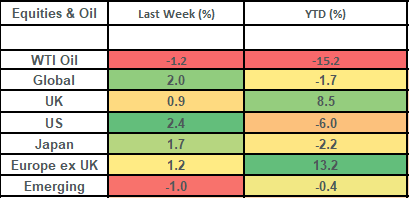
Global stock markets rose by 2% last week. This capped off a strong month which saw them rise by 5.1% in GBP terms, with US stock markets leading the way. Bond markets fell over the course of the month but rose last week as Sovereign bond yields declined.
In addition to positive news on tariffs, last week also saw US inflation (as measured by core PCE) come in at its slowest pace in over 4 years and Nvidia (the 2nd largest listed company in the global share index) post strong earnings numbers which helped propel the technology sector higher. The Global technology sector gained 2.4% last week and by 9.5% over the month of May: comfortably the best performing sector.
It’s a quiet week ahead to kick off June, with Friday’s monthly jobs data out of the US the key focus on the economic calendar.
Last week
- Global stock markets rose by 2% last week and by 5.1% in May: the best monthly gain since November 2023.
- US stocks, notably the technology sector, drove gains last week and over the month of May.
- Corporate earnings continued to come in strong.
- “Soft” (i.e. “survey”) economic data showed signs of improvement.
- Trade tensions were dialled down.
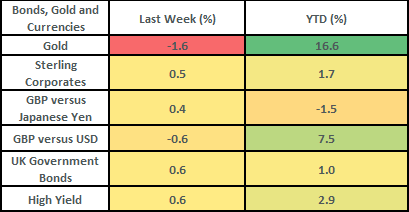
- Bond markets rose as yields ticked lower.
This week
- Friday sees the release of the monthly US jobs data (non-farm payrolls). Economists (as surveyed by Bloomberg) are expecting to see 125,000 jobs created in May, with the unemployment rate holding steady at 4.2%.
- The European Central Bank meets on Thursday: they are widely expected to cut interest rates to 2%.
- Corporate earnings reports are light on the ground. Notable companies reporting are Hewlett Packard (Tuesday), Dollar Tree (Wednesday) and Broadcom on Thursday.
Source: Bloomberg
More details:
- Global stock markets continued their bounce-back last week, rising by 2%. They are now up over 12.5% (in GBP) since their lows in April. The US (which accounts for c70% of the global index) was the best performing of the major markets last week, up by 2.4%, which took gains for the month of May to 5.4% (the best of the major countries).
- The technology sector (which is the biggest constituent of the global equity sectors making up c25% of the global share index) was the best performing sector last week and for the month of May, posting rises of 2.4% and 9.5% respectively.
- A key driver for the US equity market last week came from the strength of Nvidia’s earnings. Nvidia posted revenues of $44.1 billion which represented a 69% year-over-year (“YoY”) increase in sales and 57% growth in earnings.
- We’re now 98% of the way through the US earnings season and it has been VERY strong!
- The Q1 blended YoY earnings growth rate for the US market is 13.3%: this is significantly better than the growth rate of 7.2% that analysts (as per Factset) had been expecting before companies began reporting their numbers. Importantly, future earnings have not been revised down heavily! CY25 earnings have been revised lower by 3.5%. This is a bit larger than the average downward revision (the average downward revision over the last 10 years has been 2.3%) but is markedly better than downwards revisions that we’ve seen in previous times of crisis! For example, in Covid and the GFC earnings estimates for the year were cut by 25%!
- Having fallen to very low levels, we are starting to see a pickup in “soft” (aka “survey”) data. Last week saw the Conference Board’s Consumer Confidence Index surprise to the upside (after 5 consecutive months of declines). This followed the prior week’s PMI (Purchasing Manager’s Index) readings which came in above expectations and in “expansionary” territory.
- We believe that the survey data will likely catch up with the resilient “hard” (i.e. actual realized) data and it is worth remembering that future returns have generally been good when confidence is low. The University of Michigan Consumer Sentiment Index is a decent case in point here: it has dipped below a reading of 60 – a historically low reading. One year forward, US stock market returns have not always been positive from these levels, but the average 1 year forward return is c12% in GBP terms (looking at data going back to this index’s inception in January 1978).
- Last week also saw a dialing down of trade tensions. The week kicked off with President Trump saying that he would delay the introduction of a new 50% tariff on imports from the EU until July 9th. There then came news later in the week that the US Court of International Trade had ruled that President Trump did not have the authority to impose the vast majority of the global tariffs unveiled on “Liberation Day” (2nd April): which had been the original cause of the market turmoil. This ruling is being appealed by the Trump administration.
- US inflation (as measured by core personal consumption expenditures (PCE)) came in at 2.5% YoY for April. This was in line with expectations but represented the lowest reading since March 2021. This, combined with some weaker than expected bond auctions over the course of the week, helped to push sovereign bond yields lower.
- Bond yields ticked lower last week, which saw UK gilts rise by 0.6% on the week and US treasuries rise by 0.8%. Both markets were down over the course of May (to the tune of c1%). Credit markets held up better in May as spreads (for both High Yield and Investment Grade) continued to contract.
The value of investments and the income from them can go down as well as up and you could get back less than you invested. Past performance is not a reliable indicator of future performance.
The content of this article is not intended to be or does not constitute investment research as defined by the Financial Conduct Authority. The content should also not be relied upon when making investment decisions, and at no point should the information be treated as specific advice. The article has no regard for the specific investment objectives, financial situation or needs of any specific client, person, or entity.